
Python Basics
content
Highlight
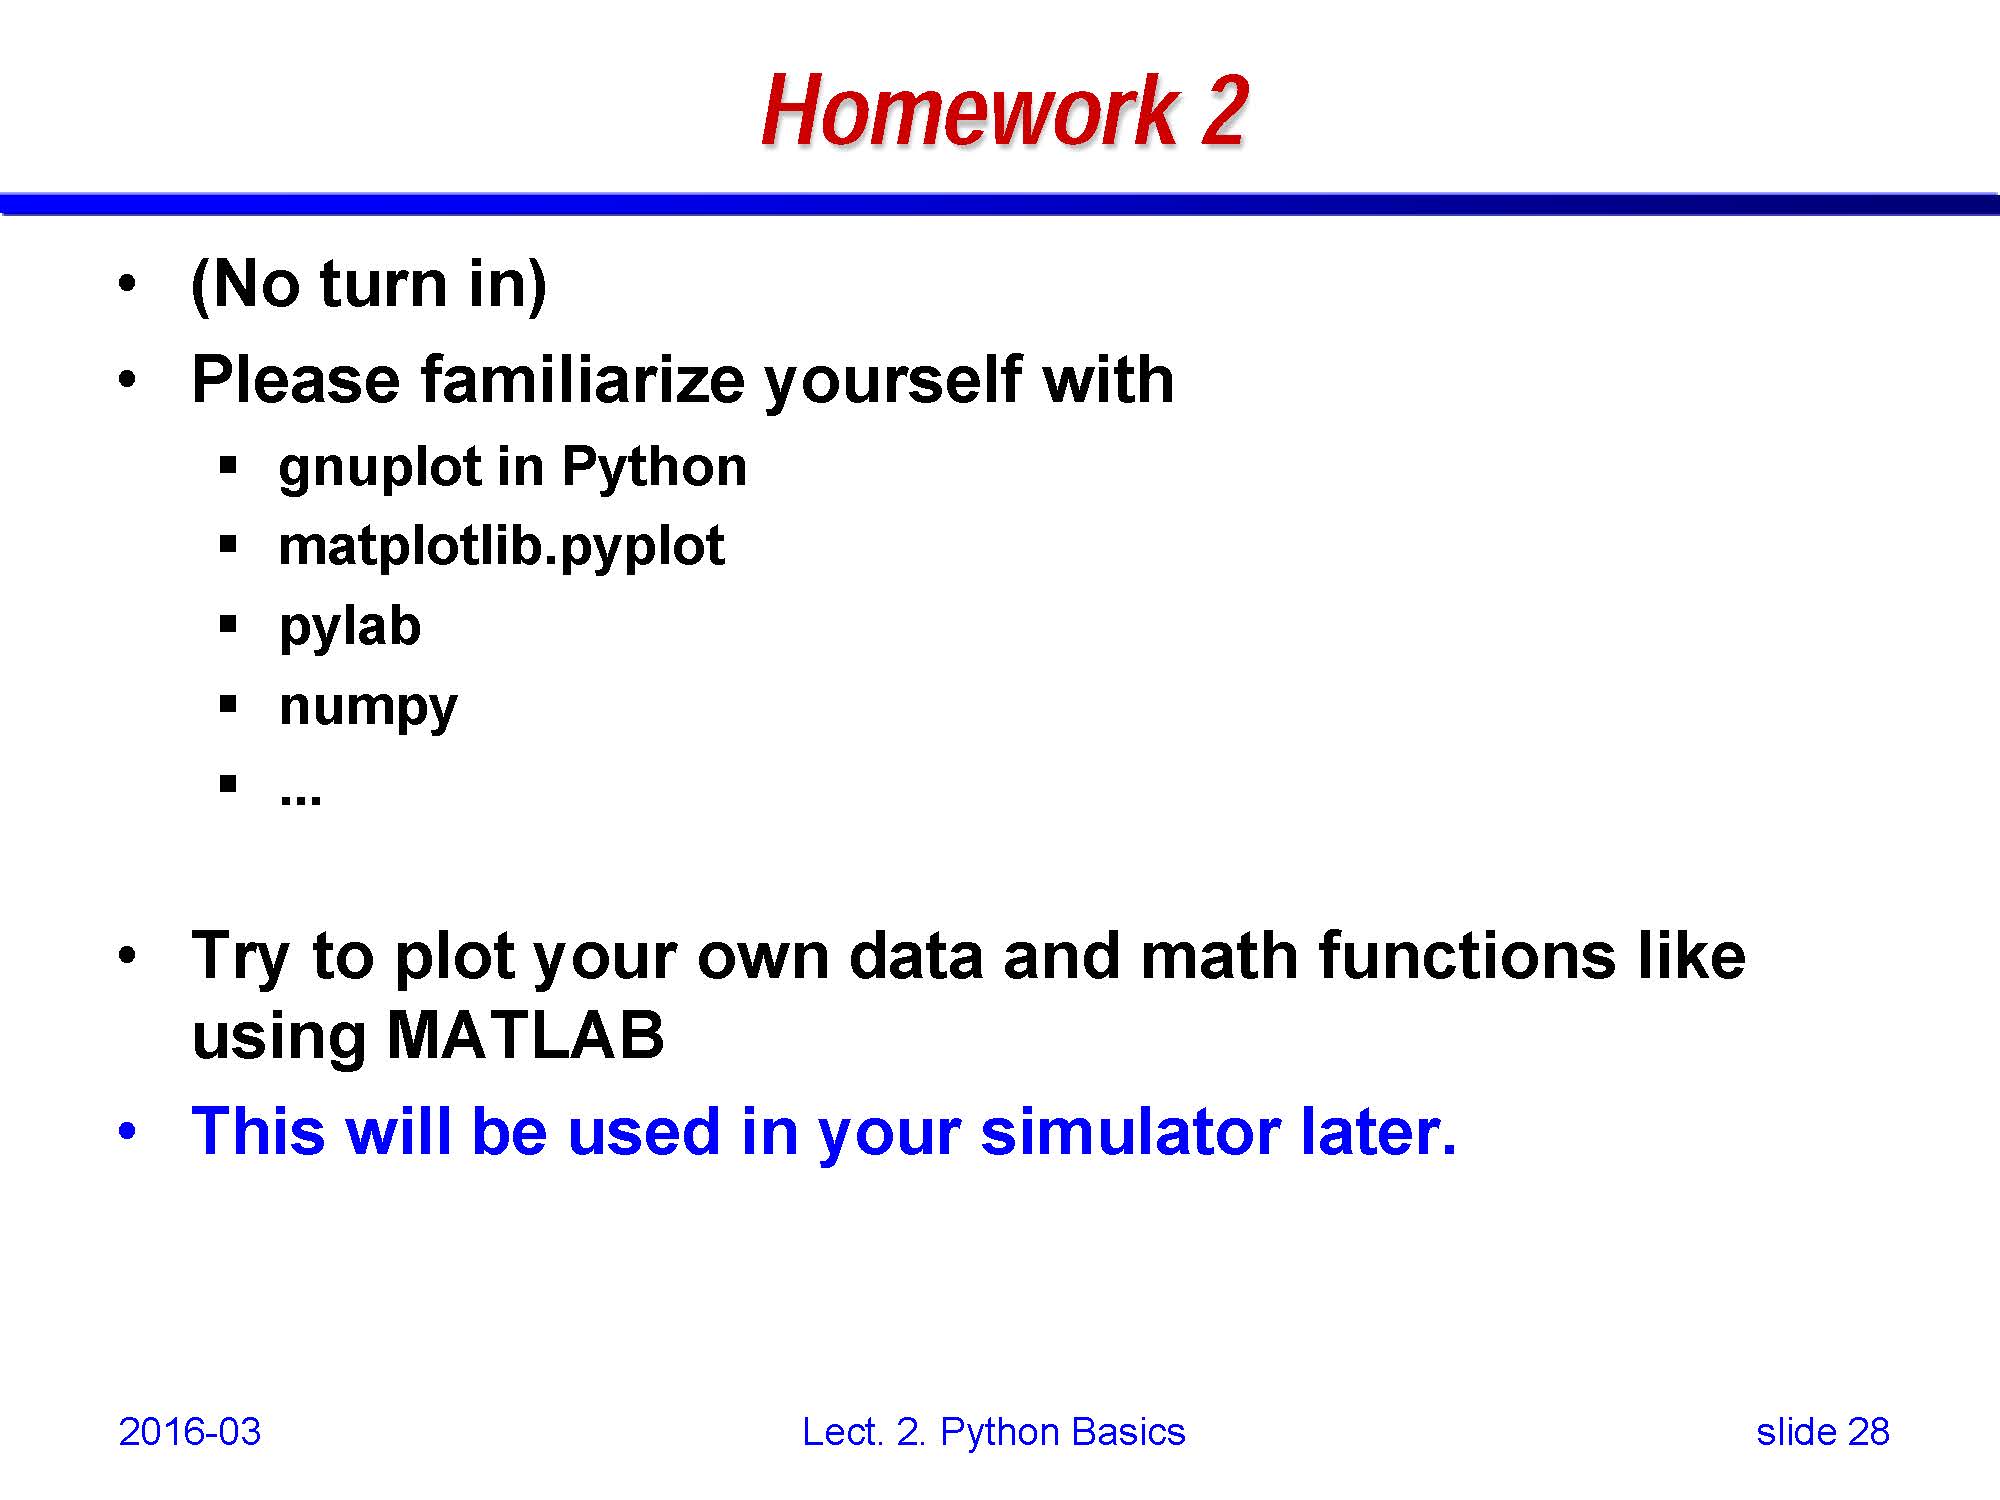
HW 2 (No turn in) please familiarize yourself with
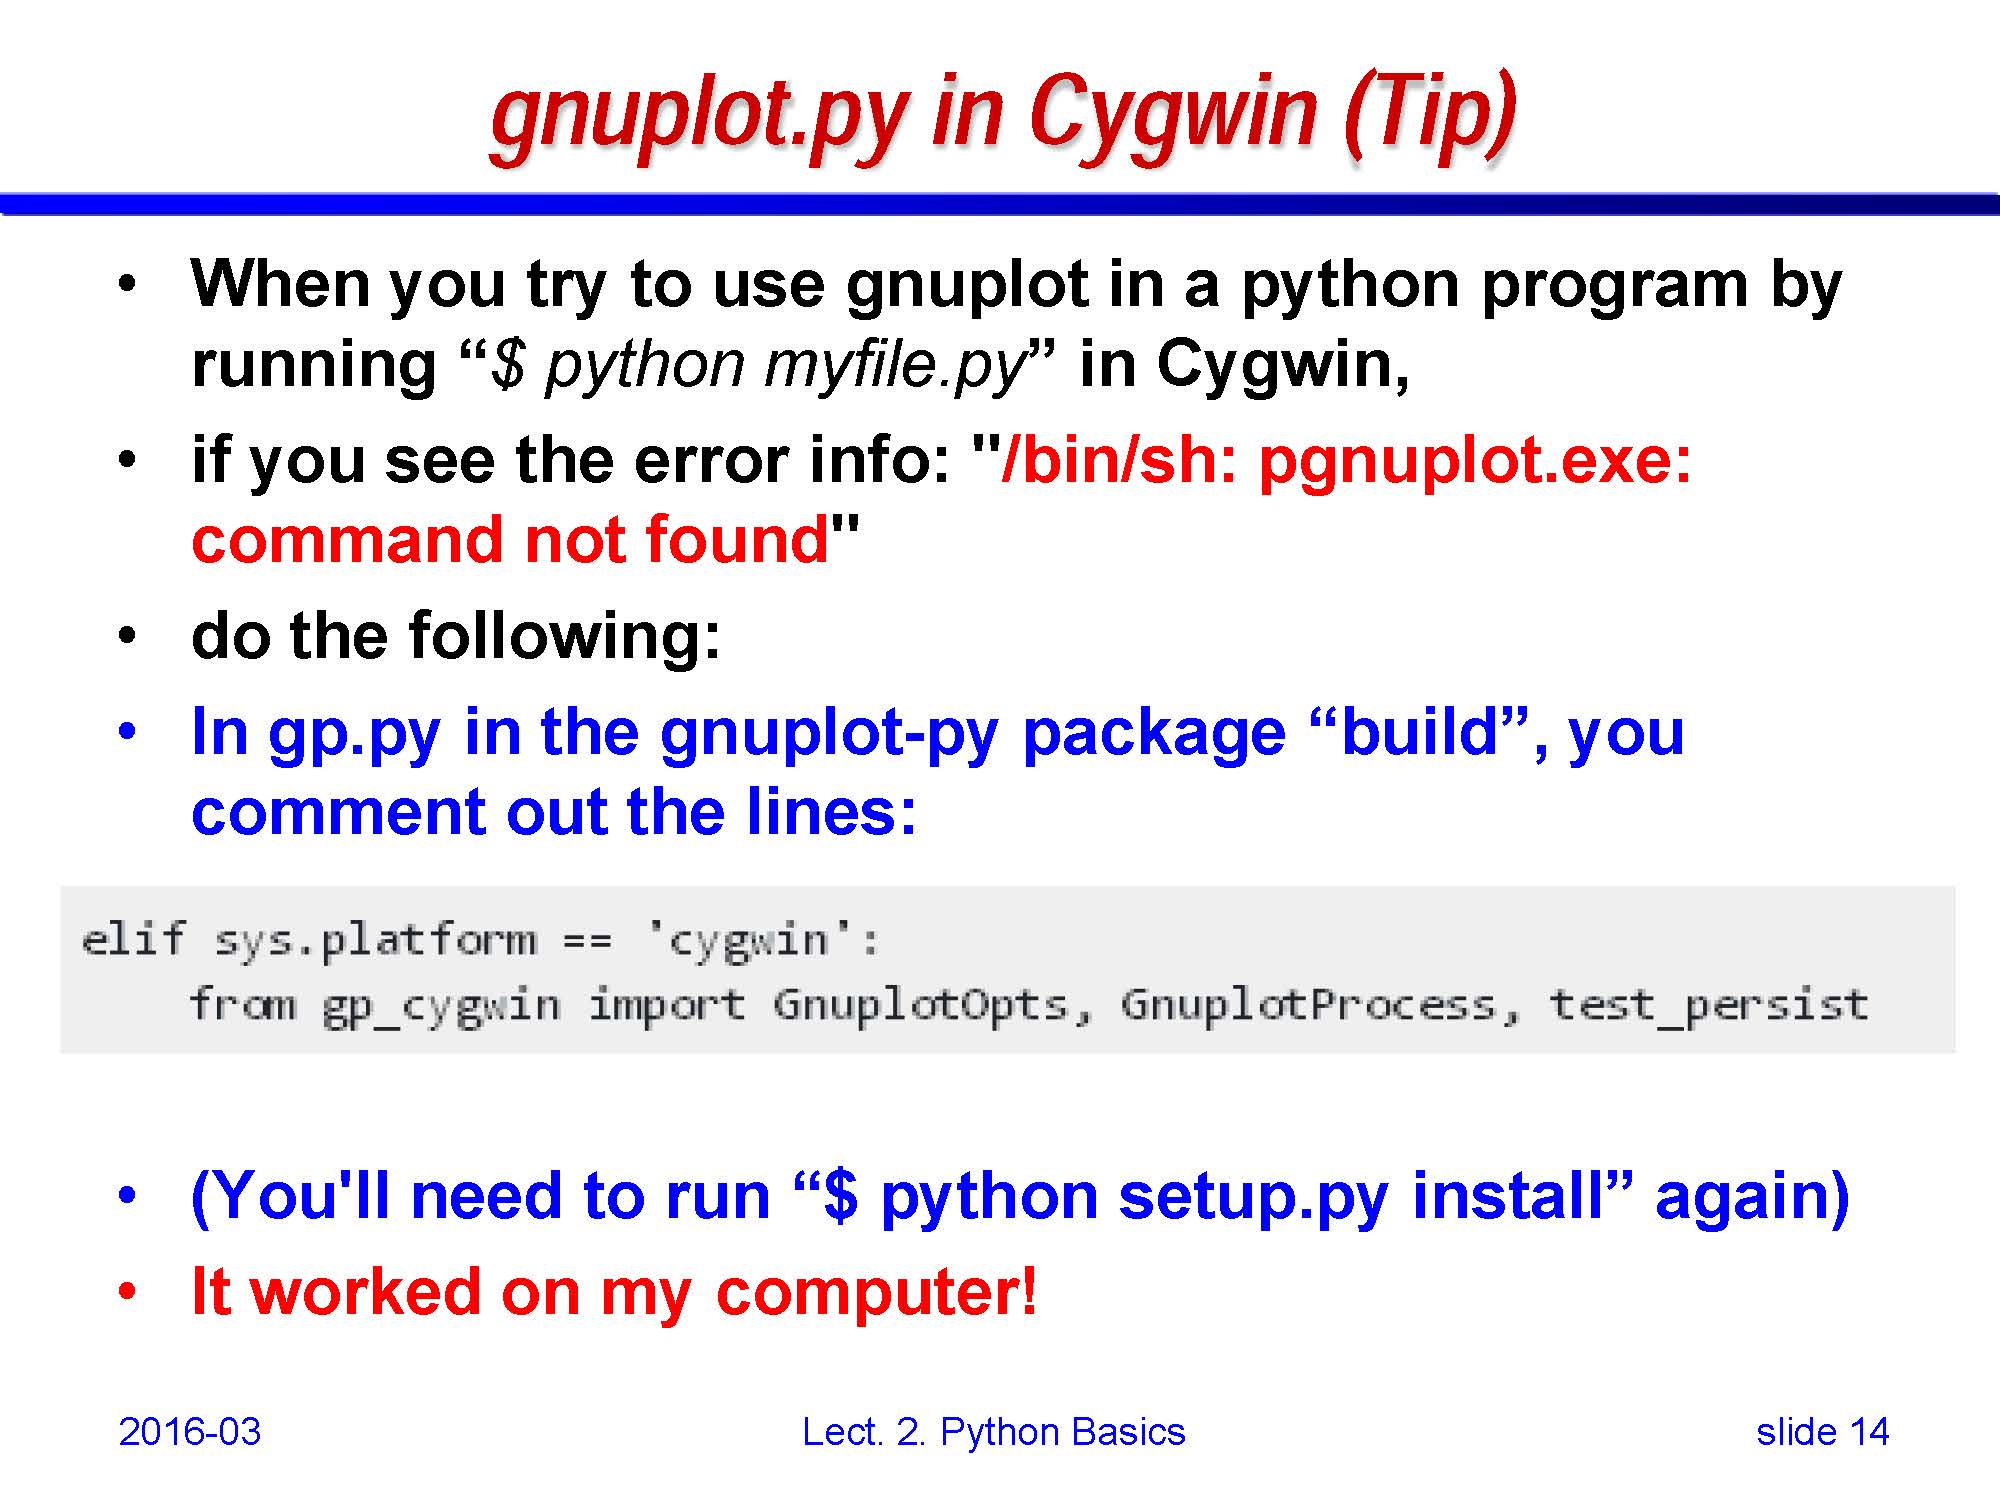
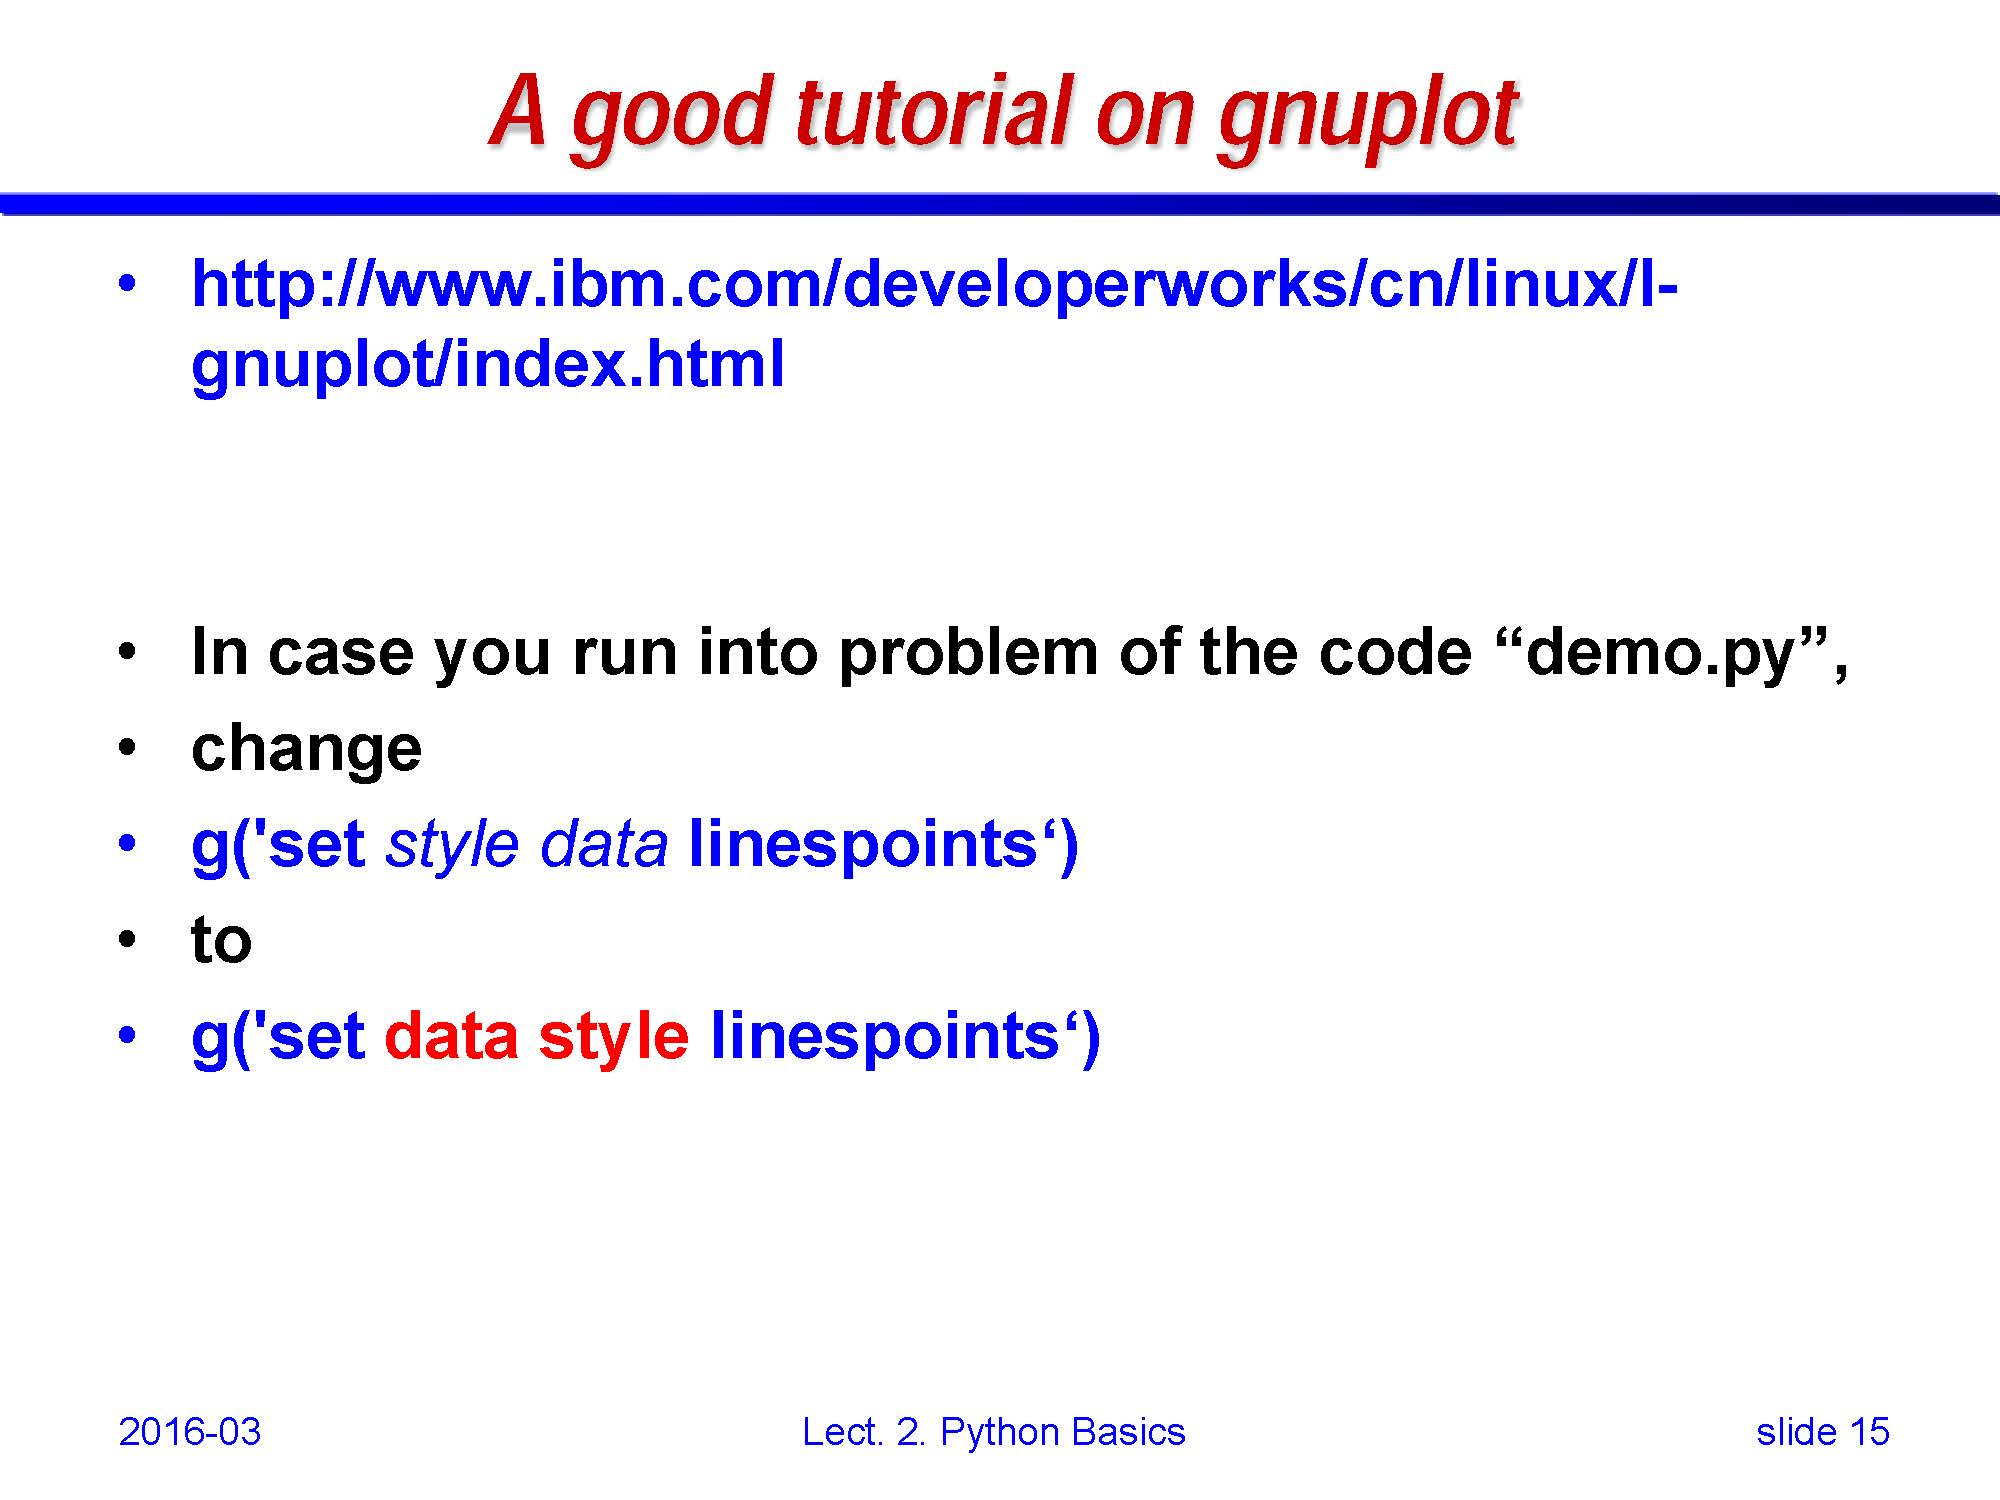
- gnuplot in Python
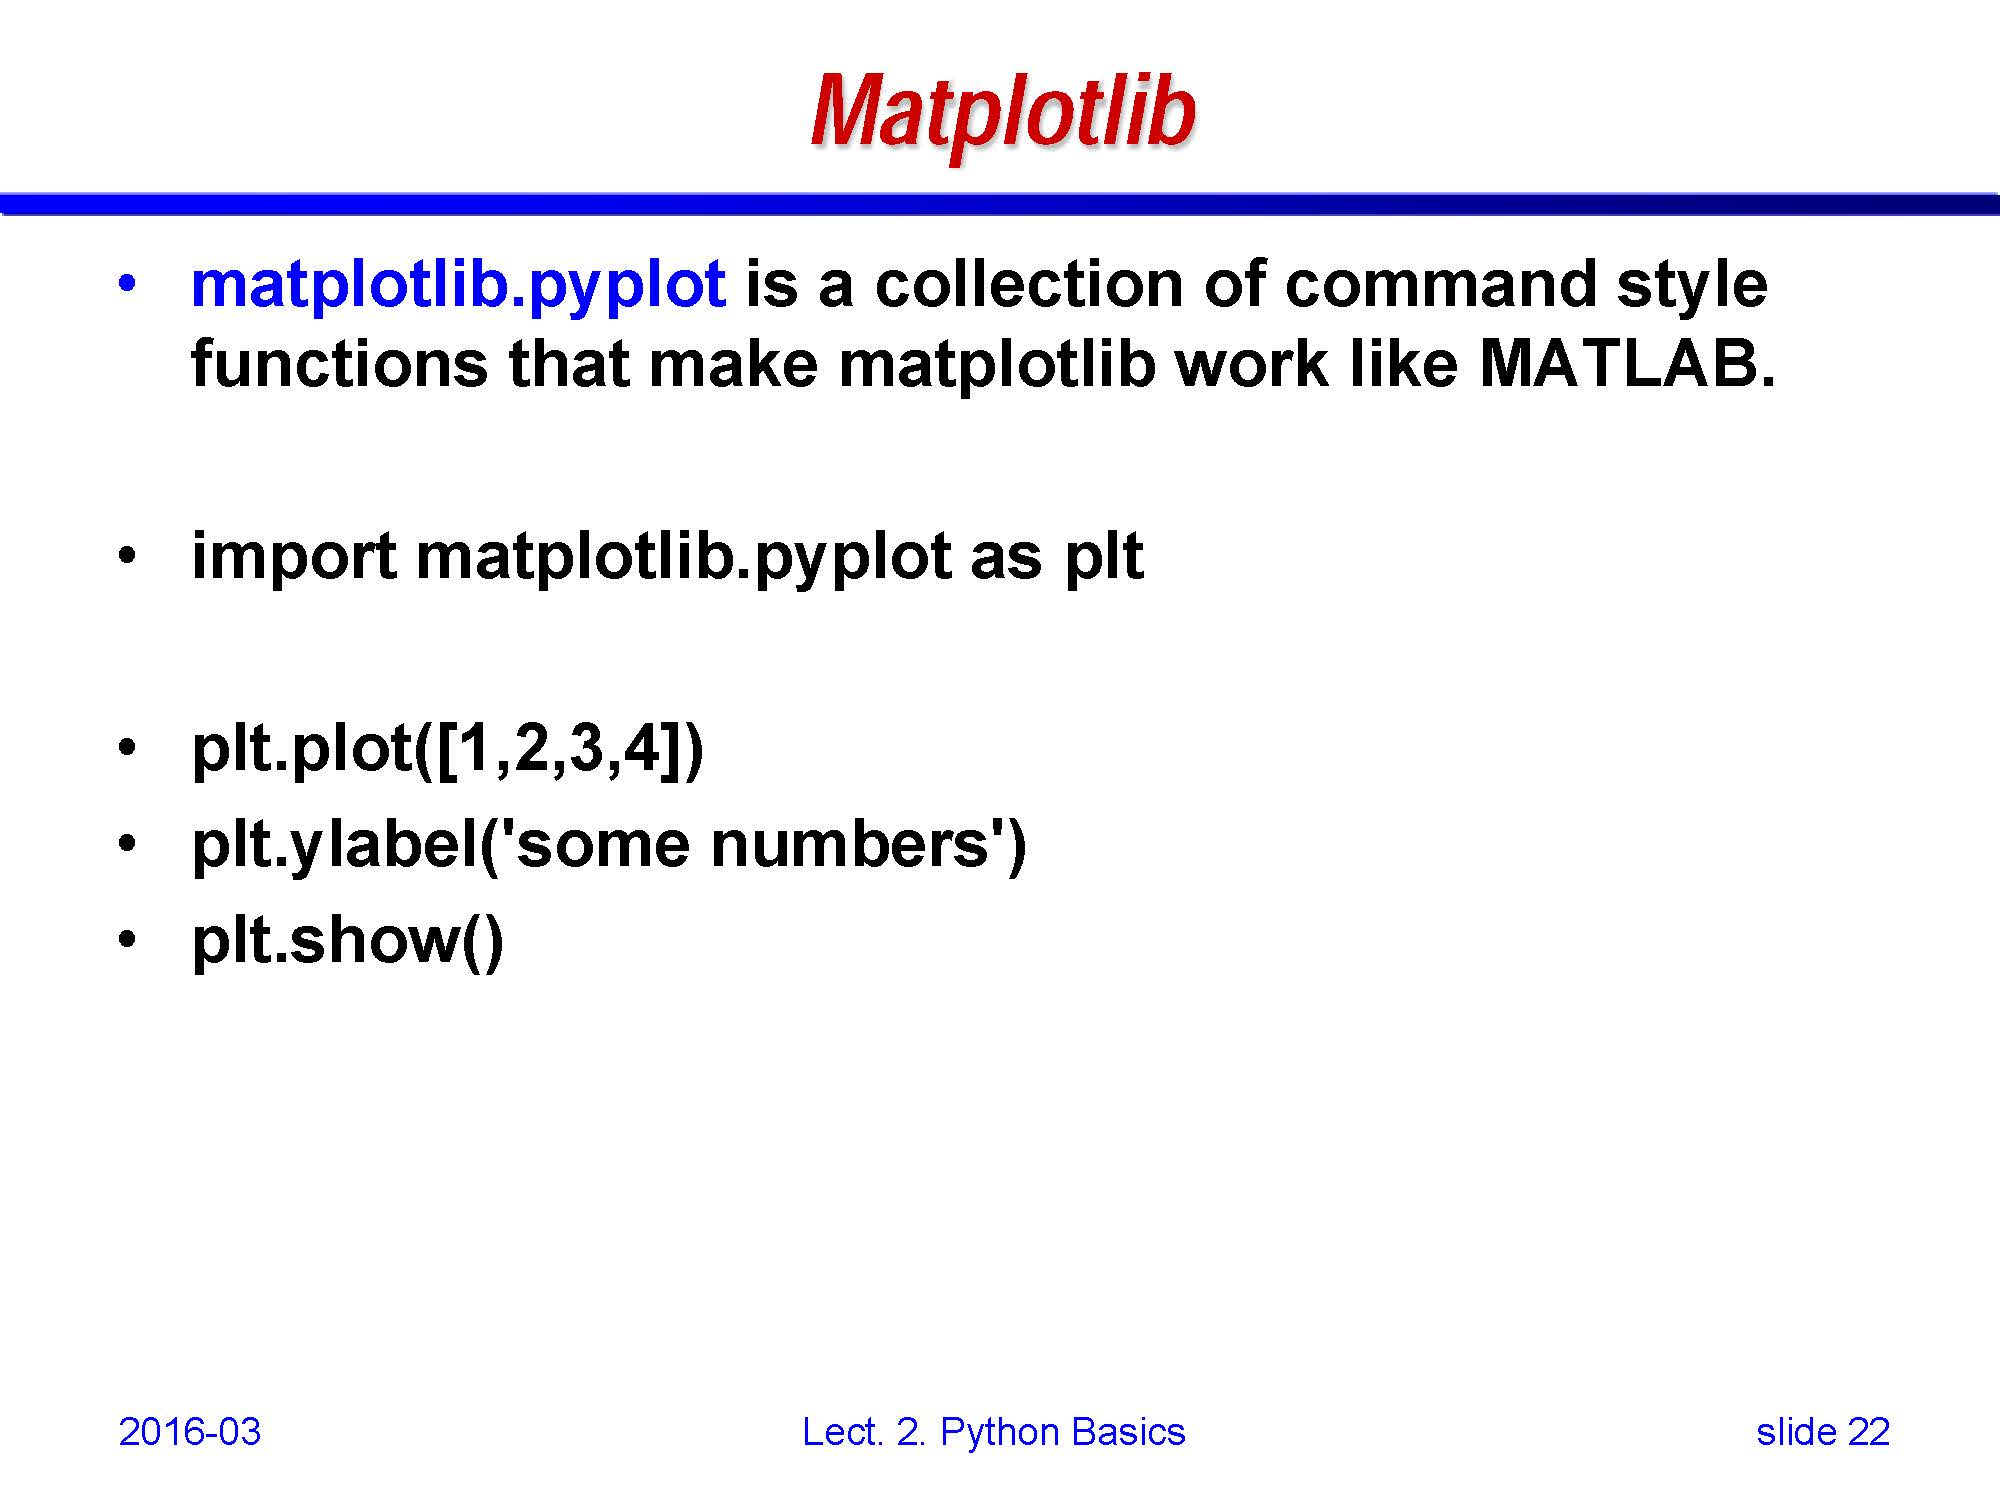
- matplotlib.pyplot
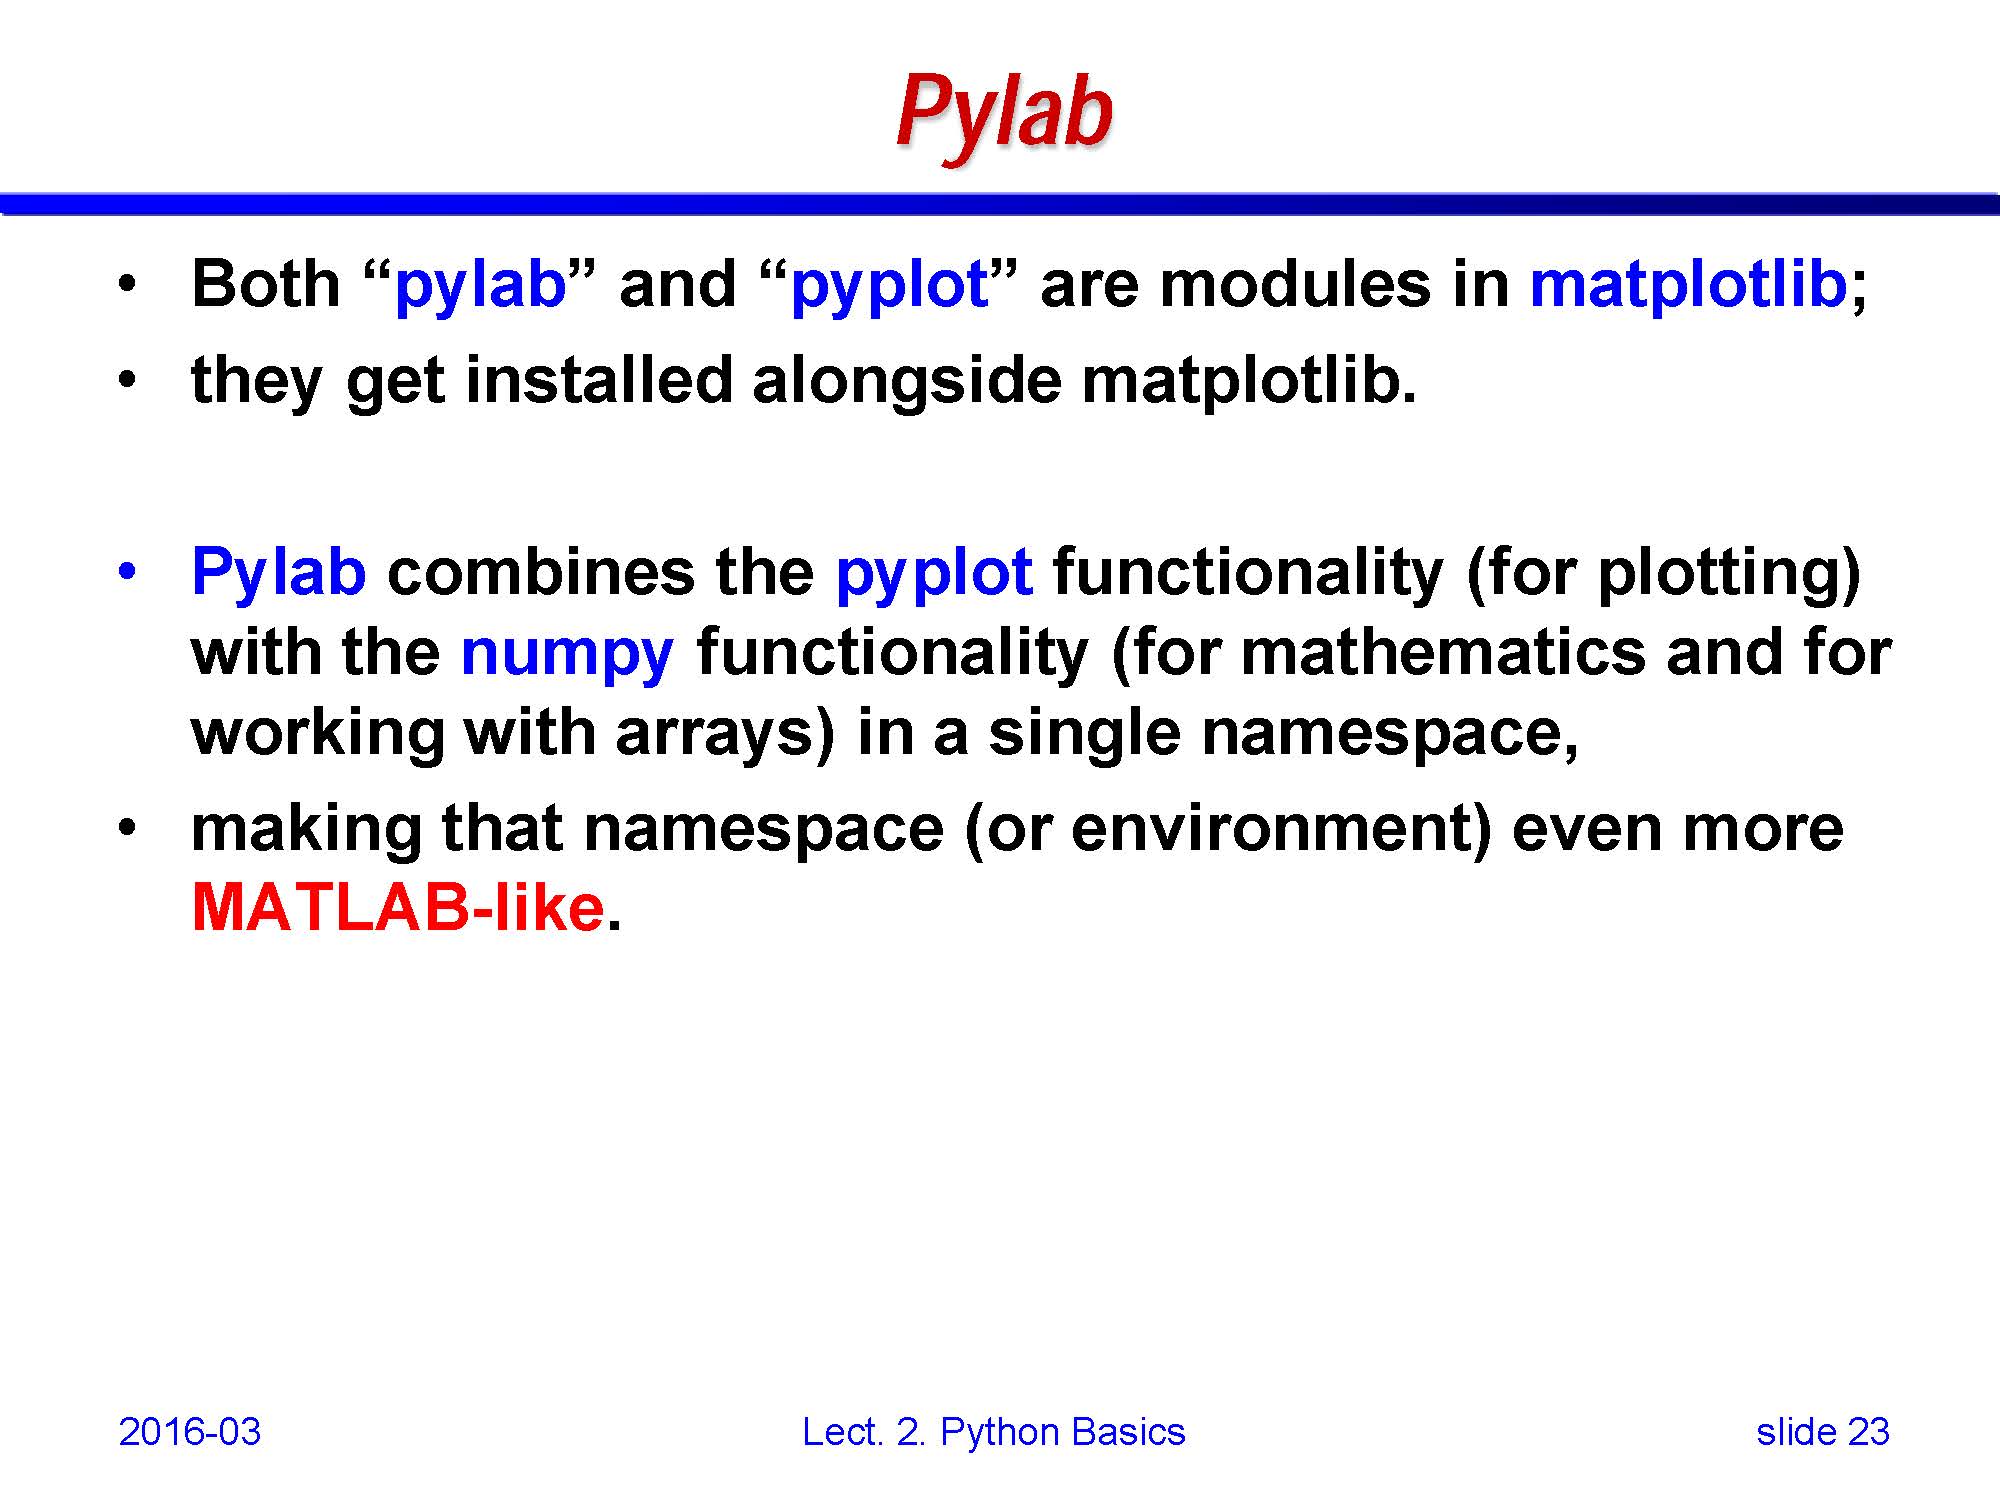
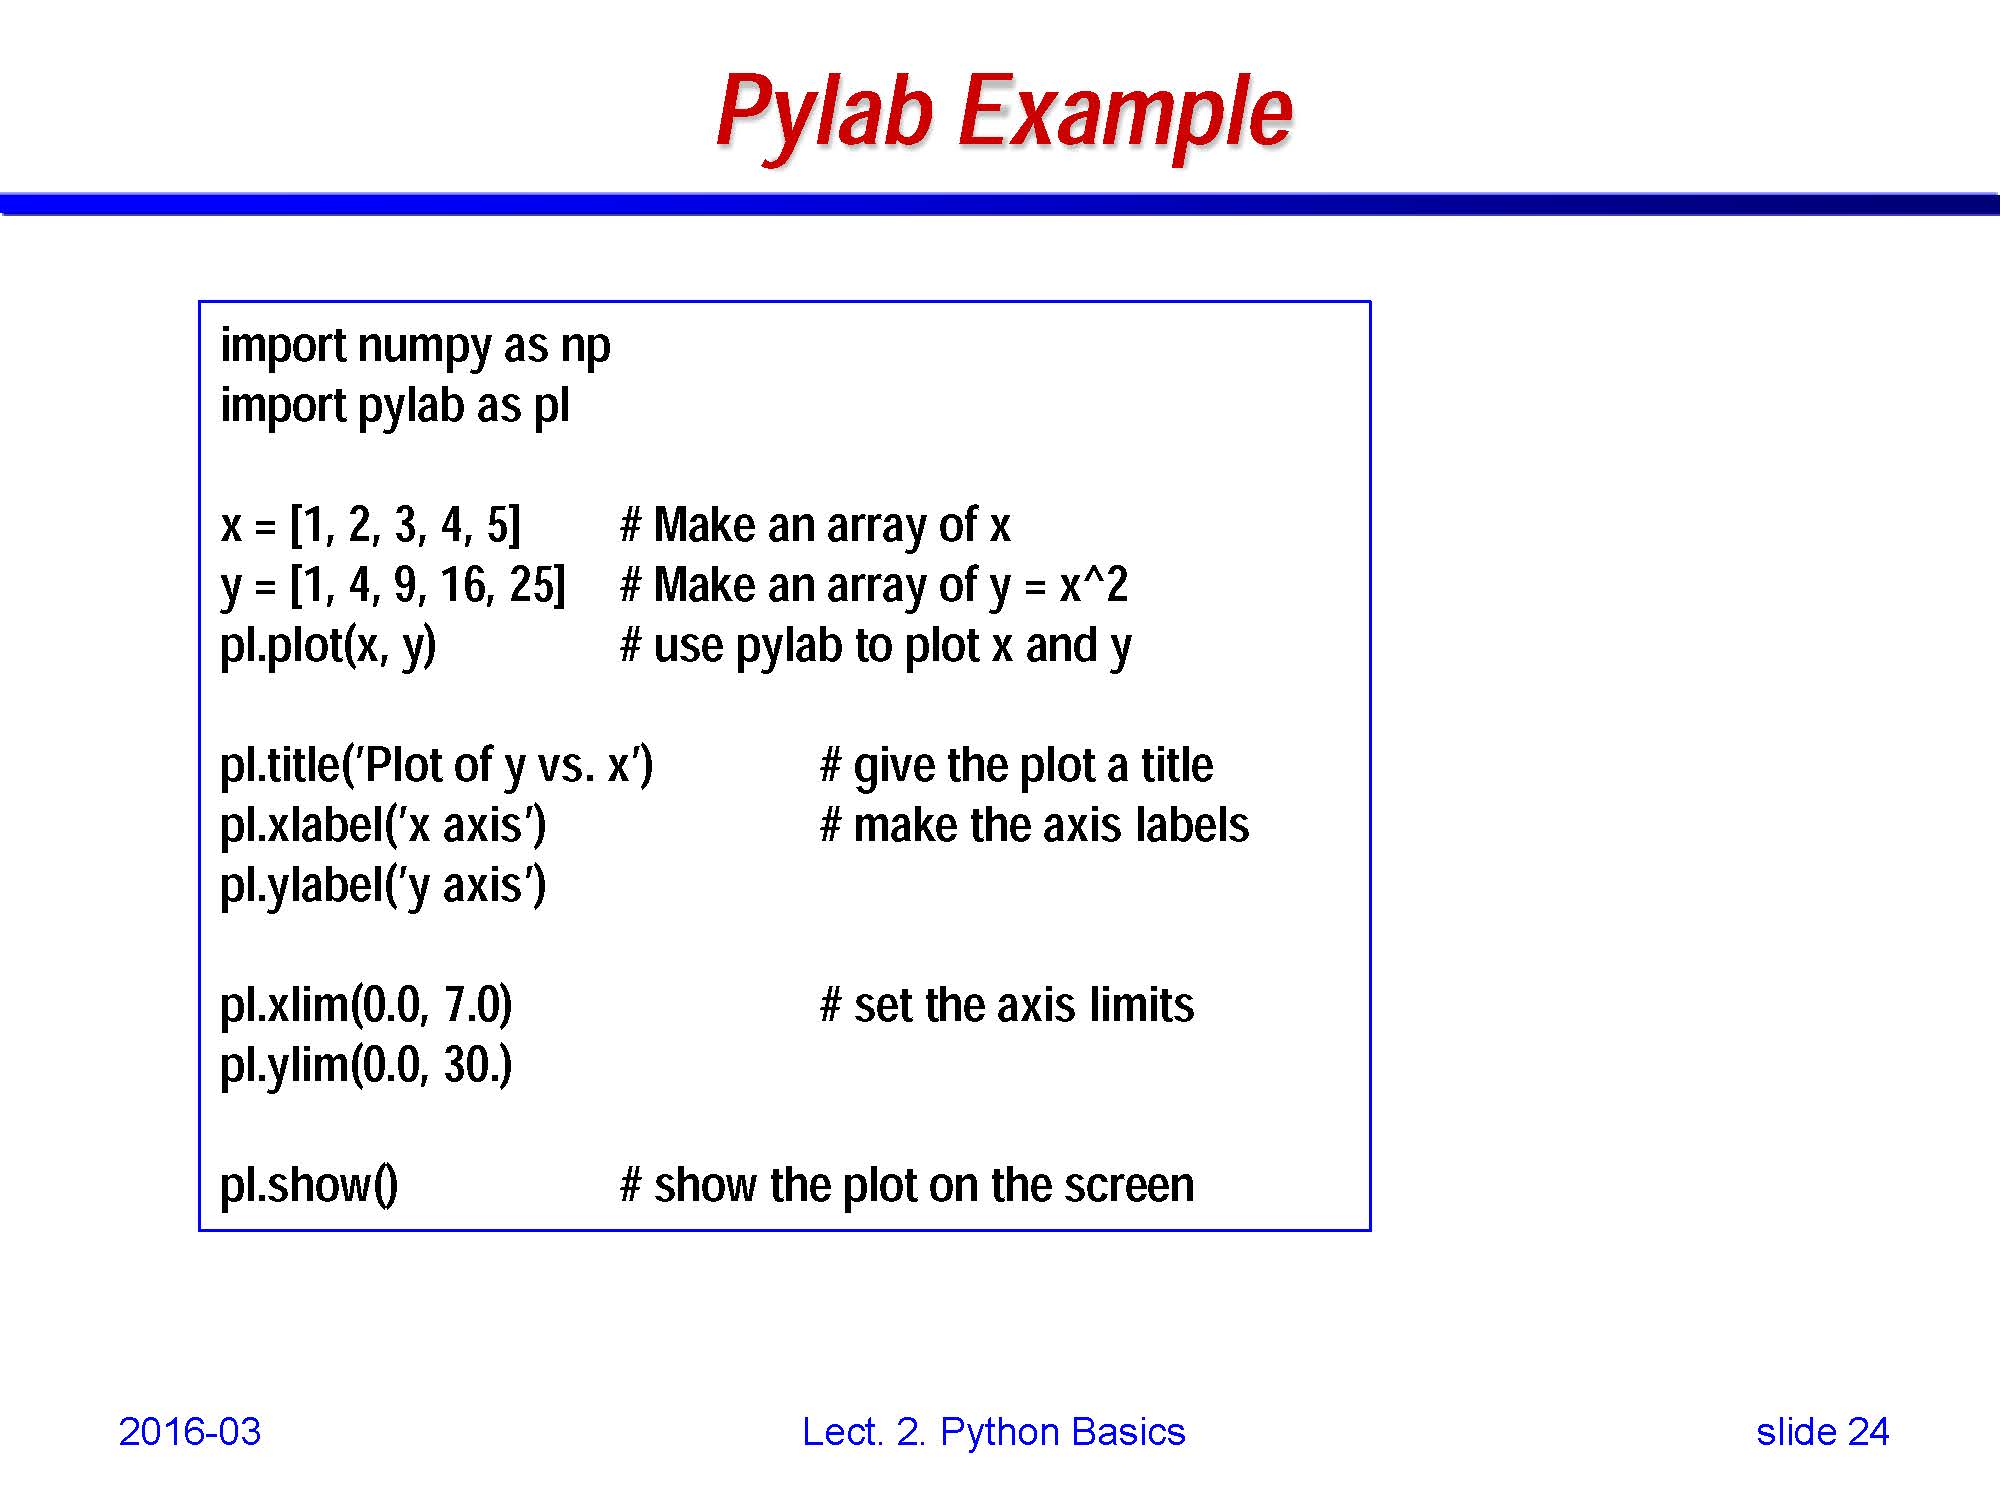
- pylab
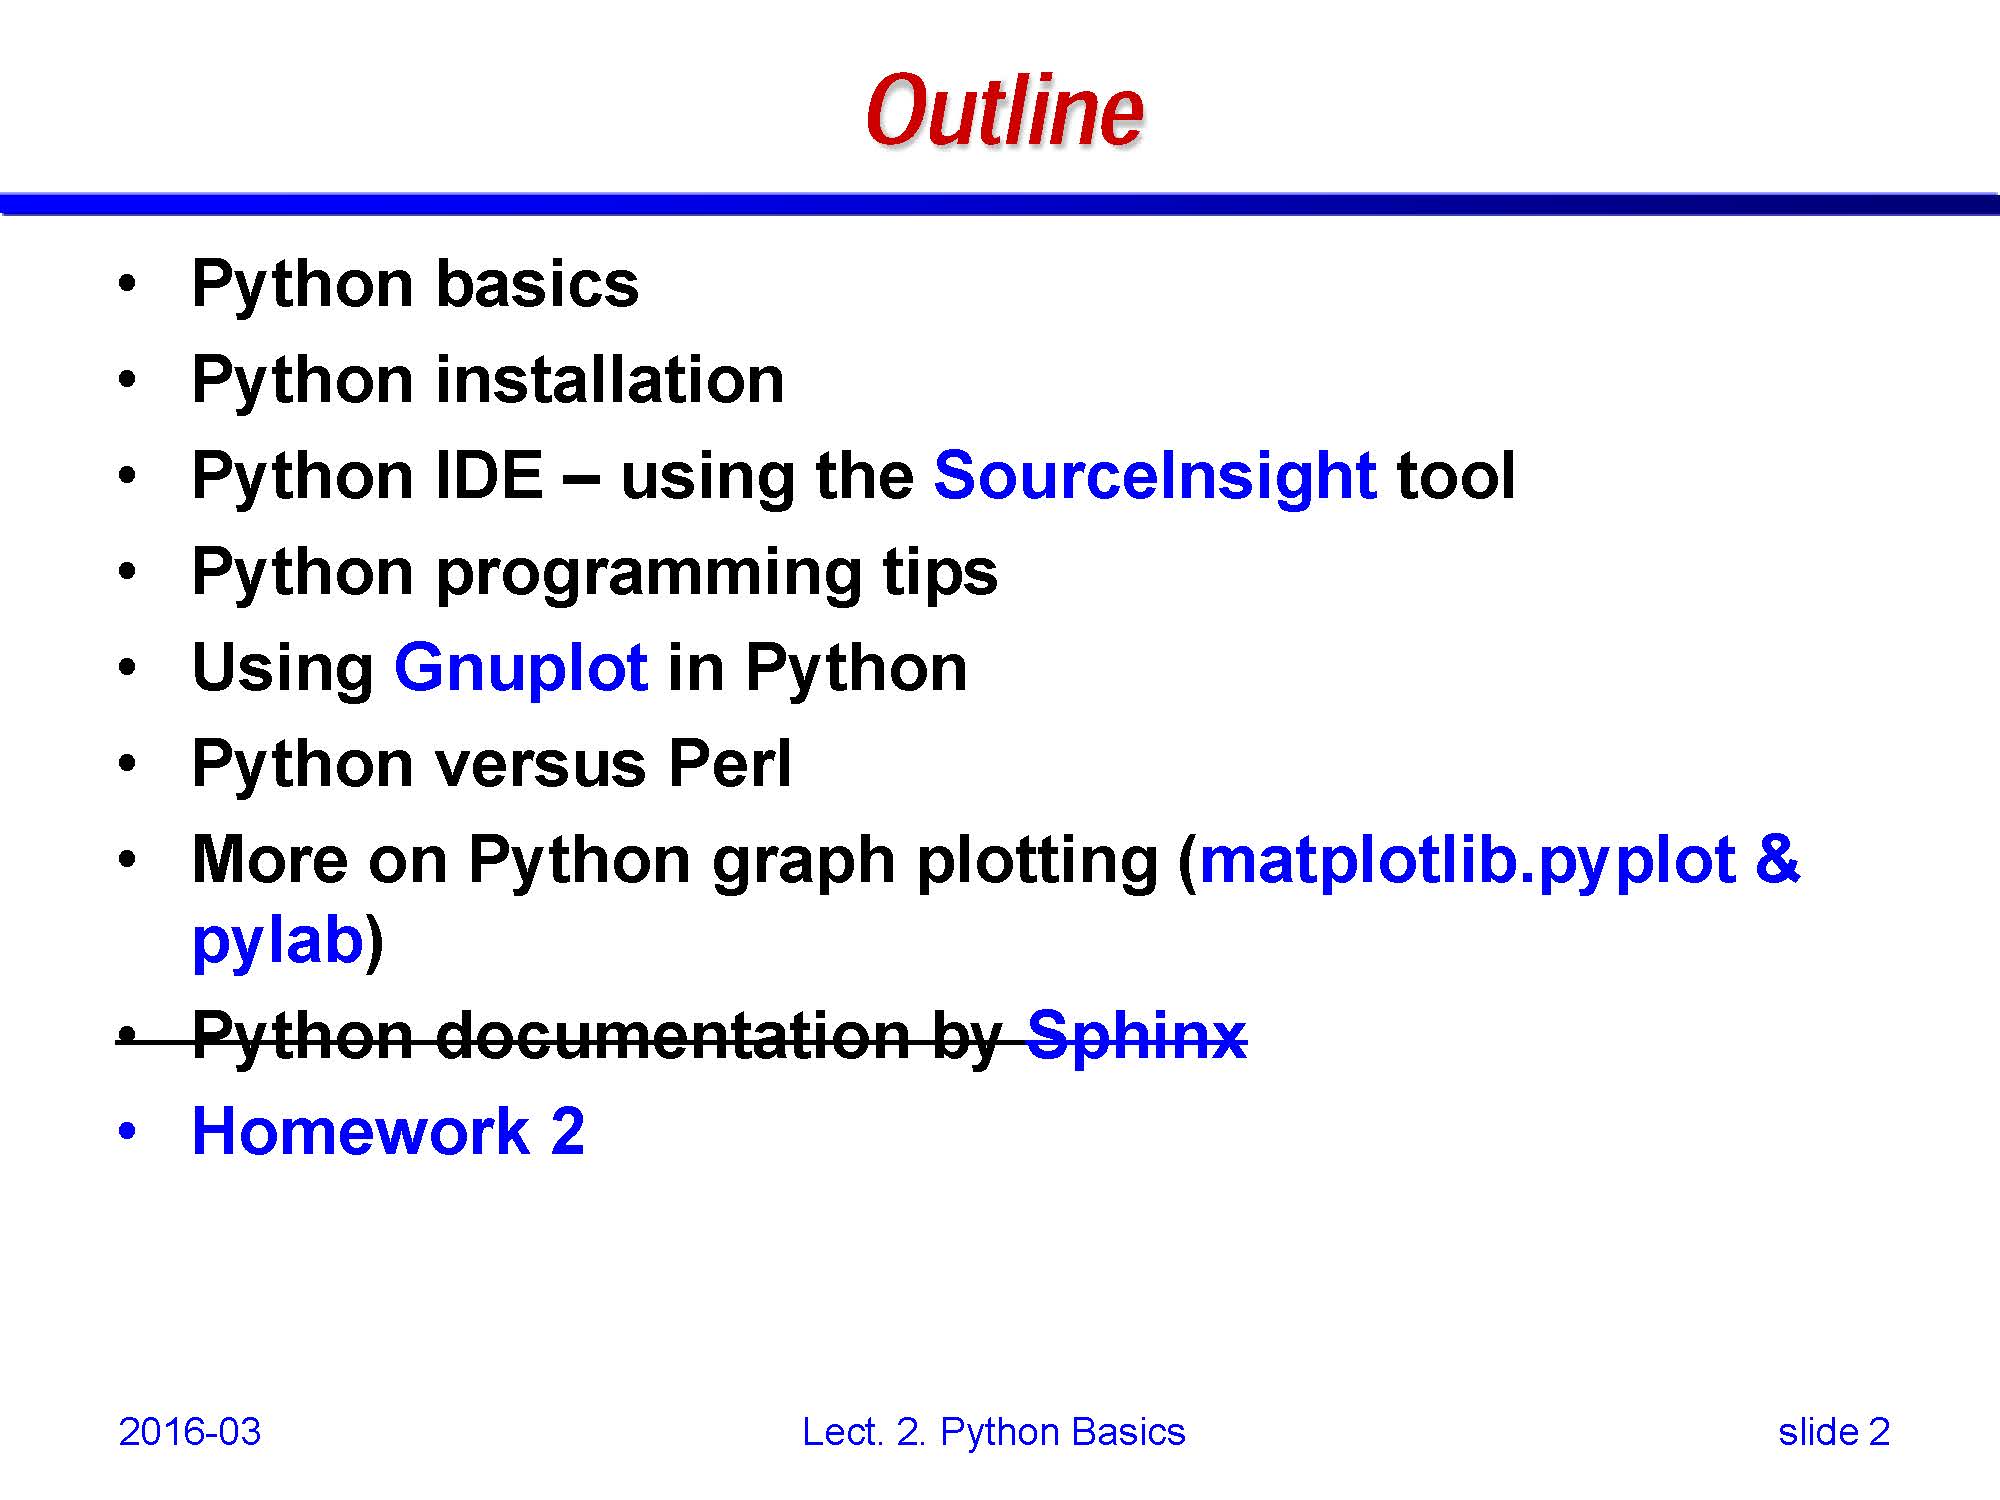
• Python basics
• Python installation
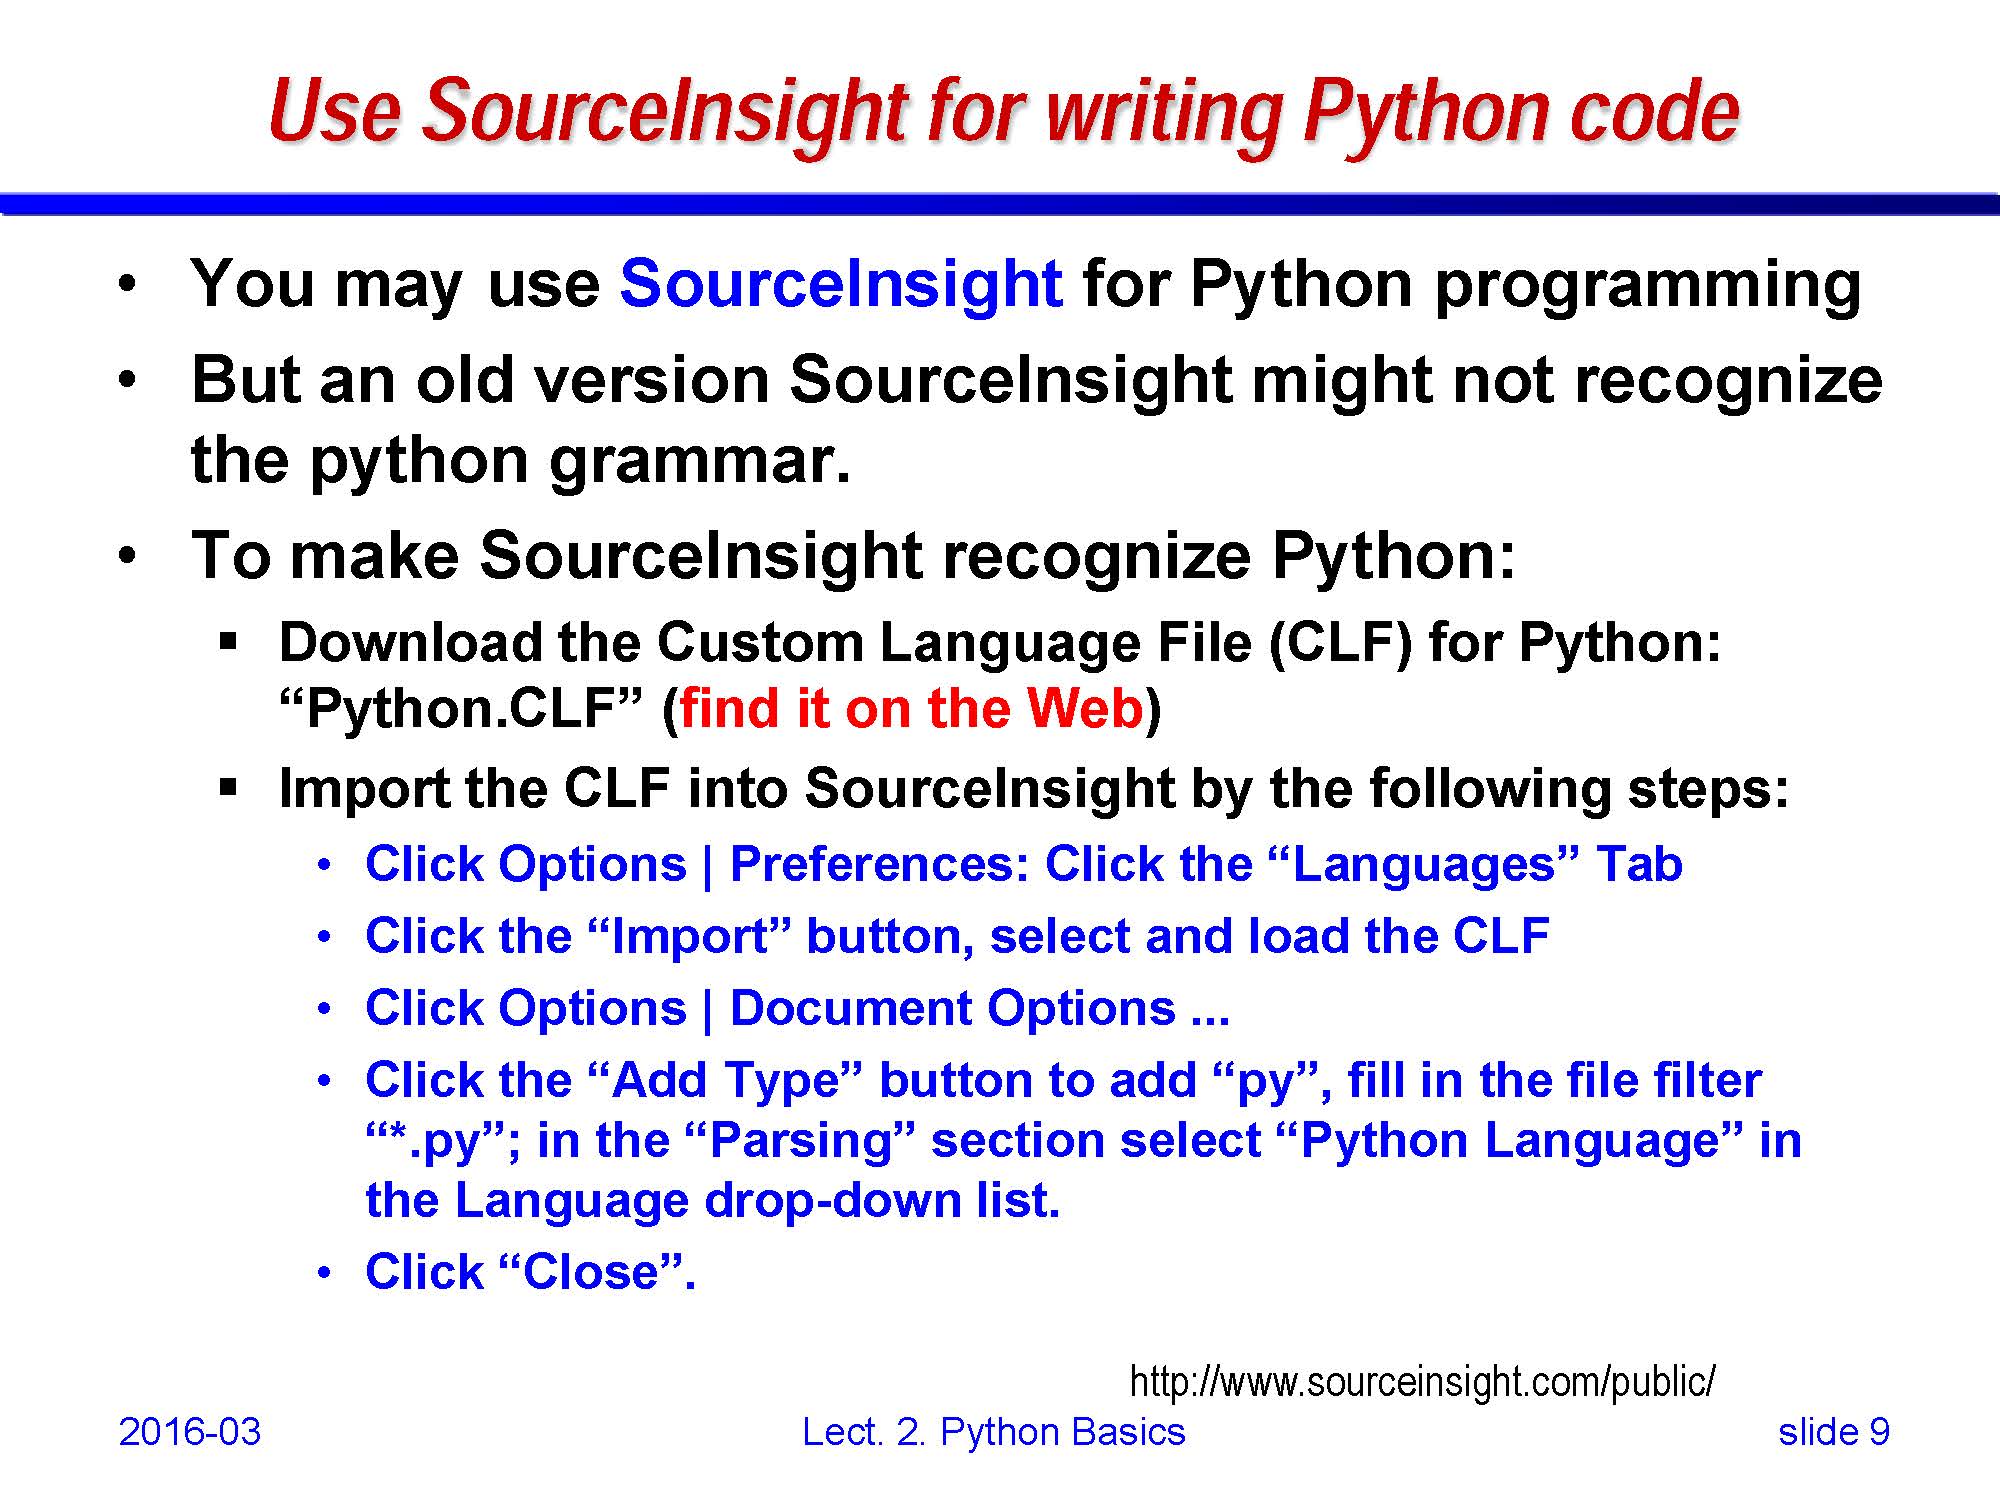
• Python IDE
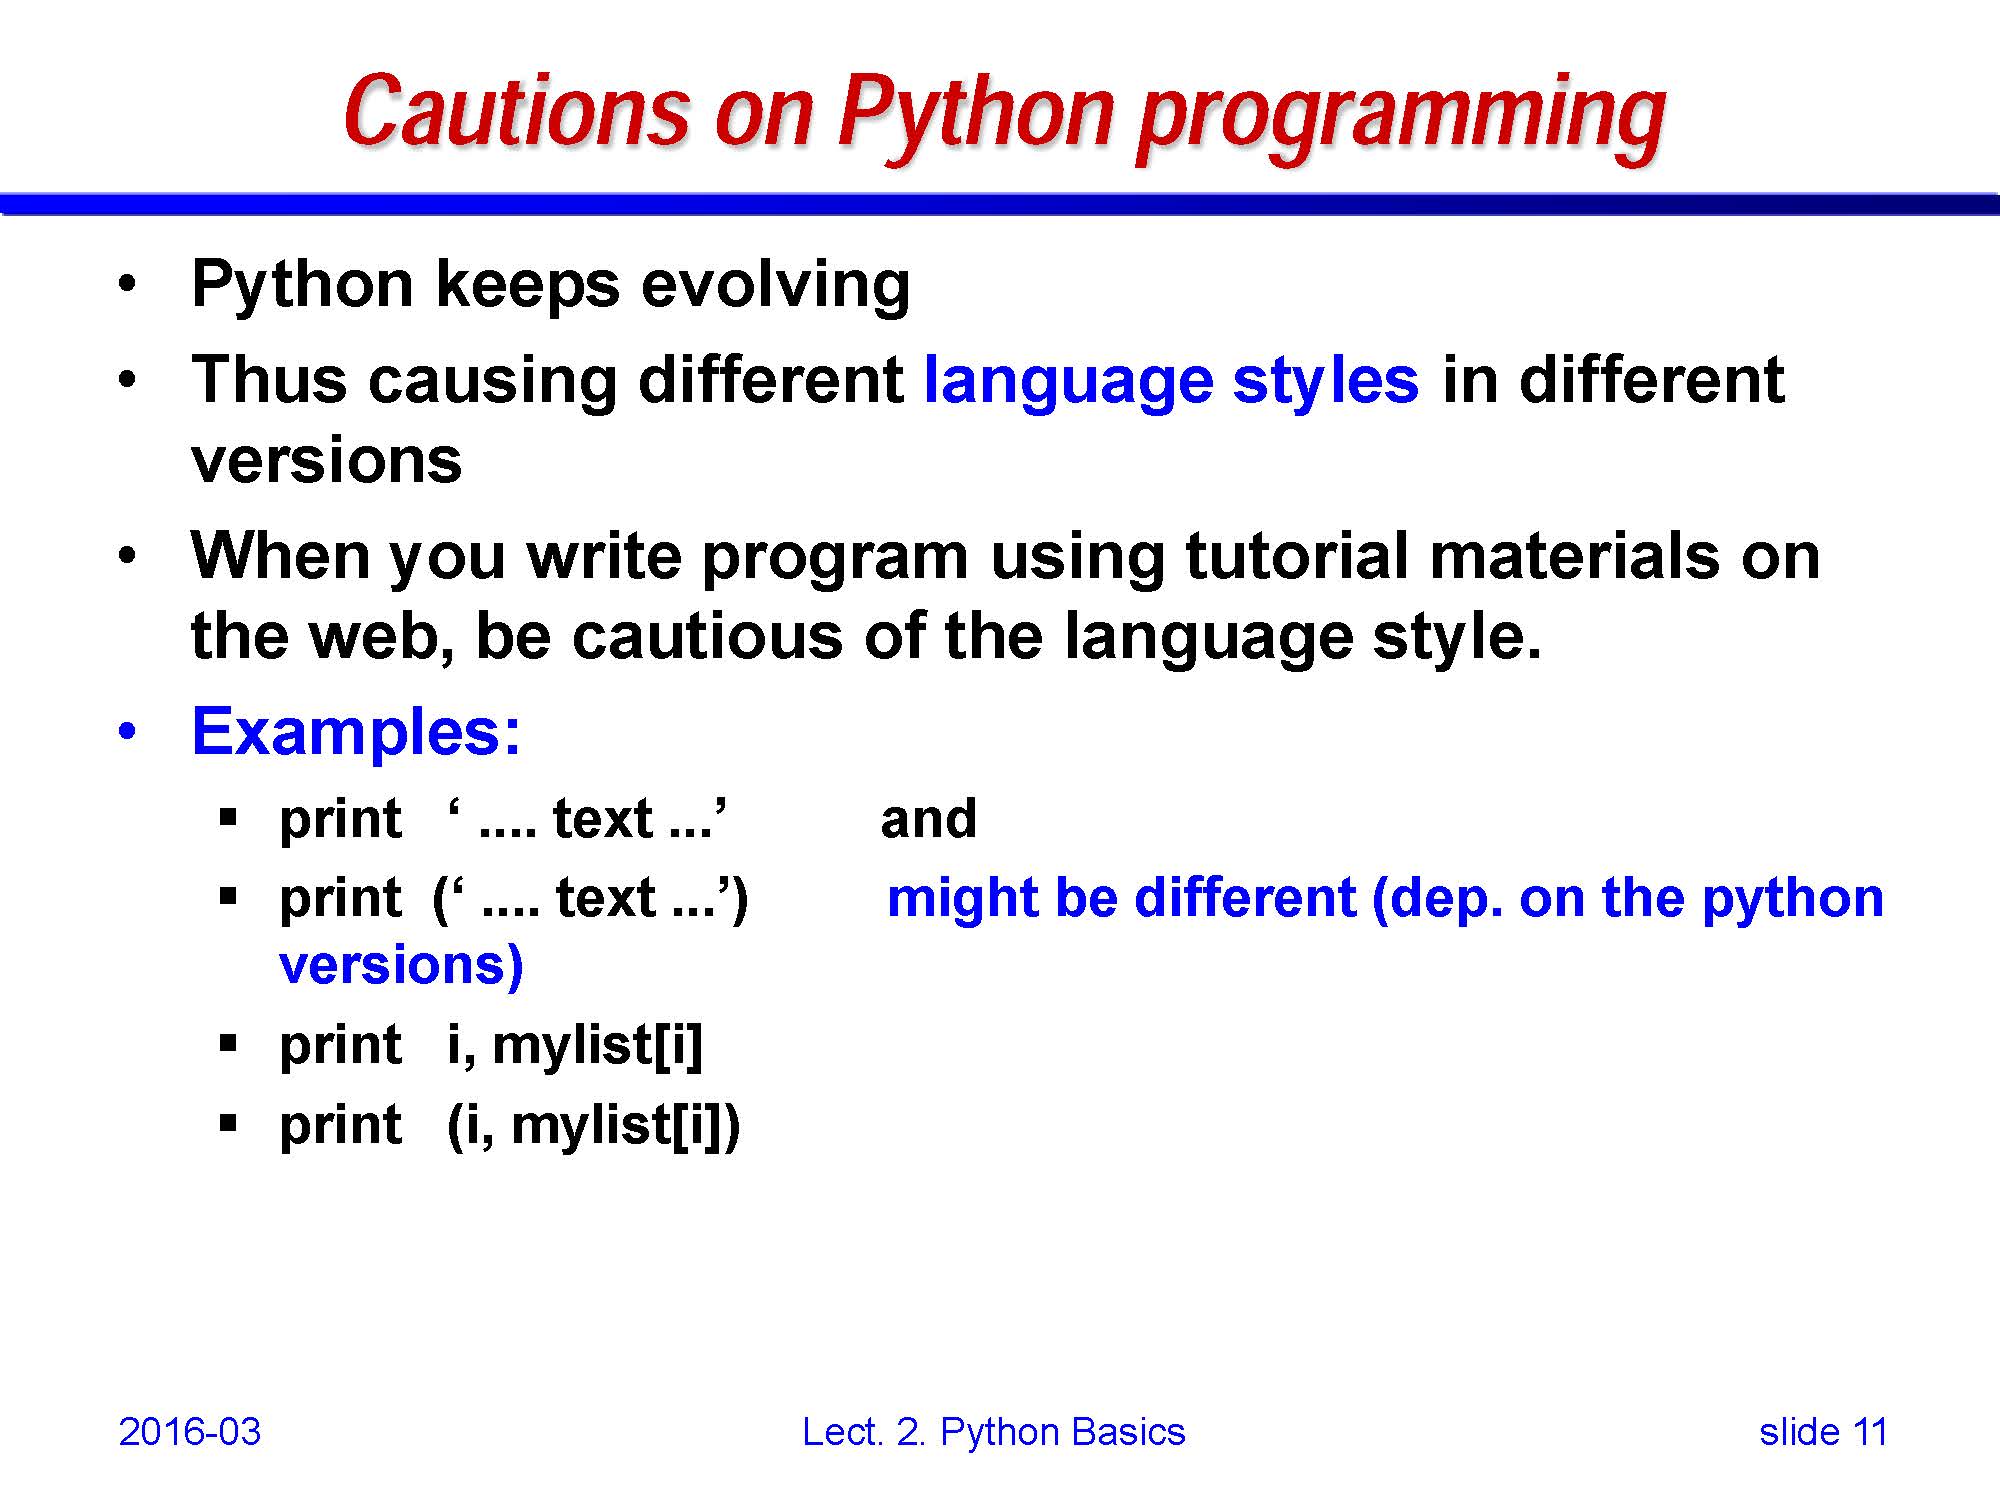
• Python programming tips
• Using Gnuplot in Python
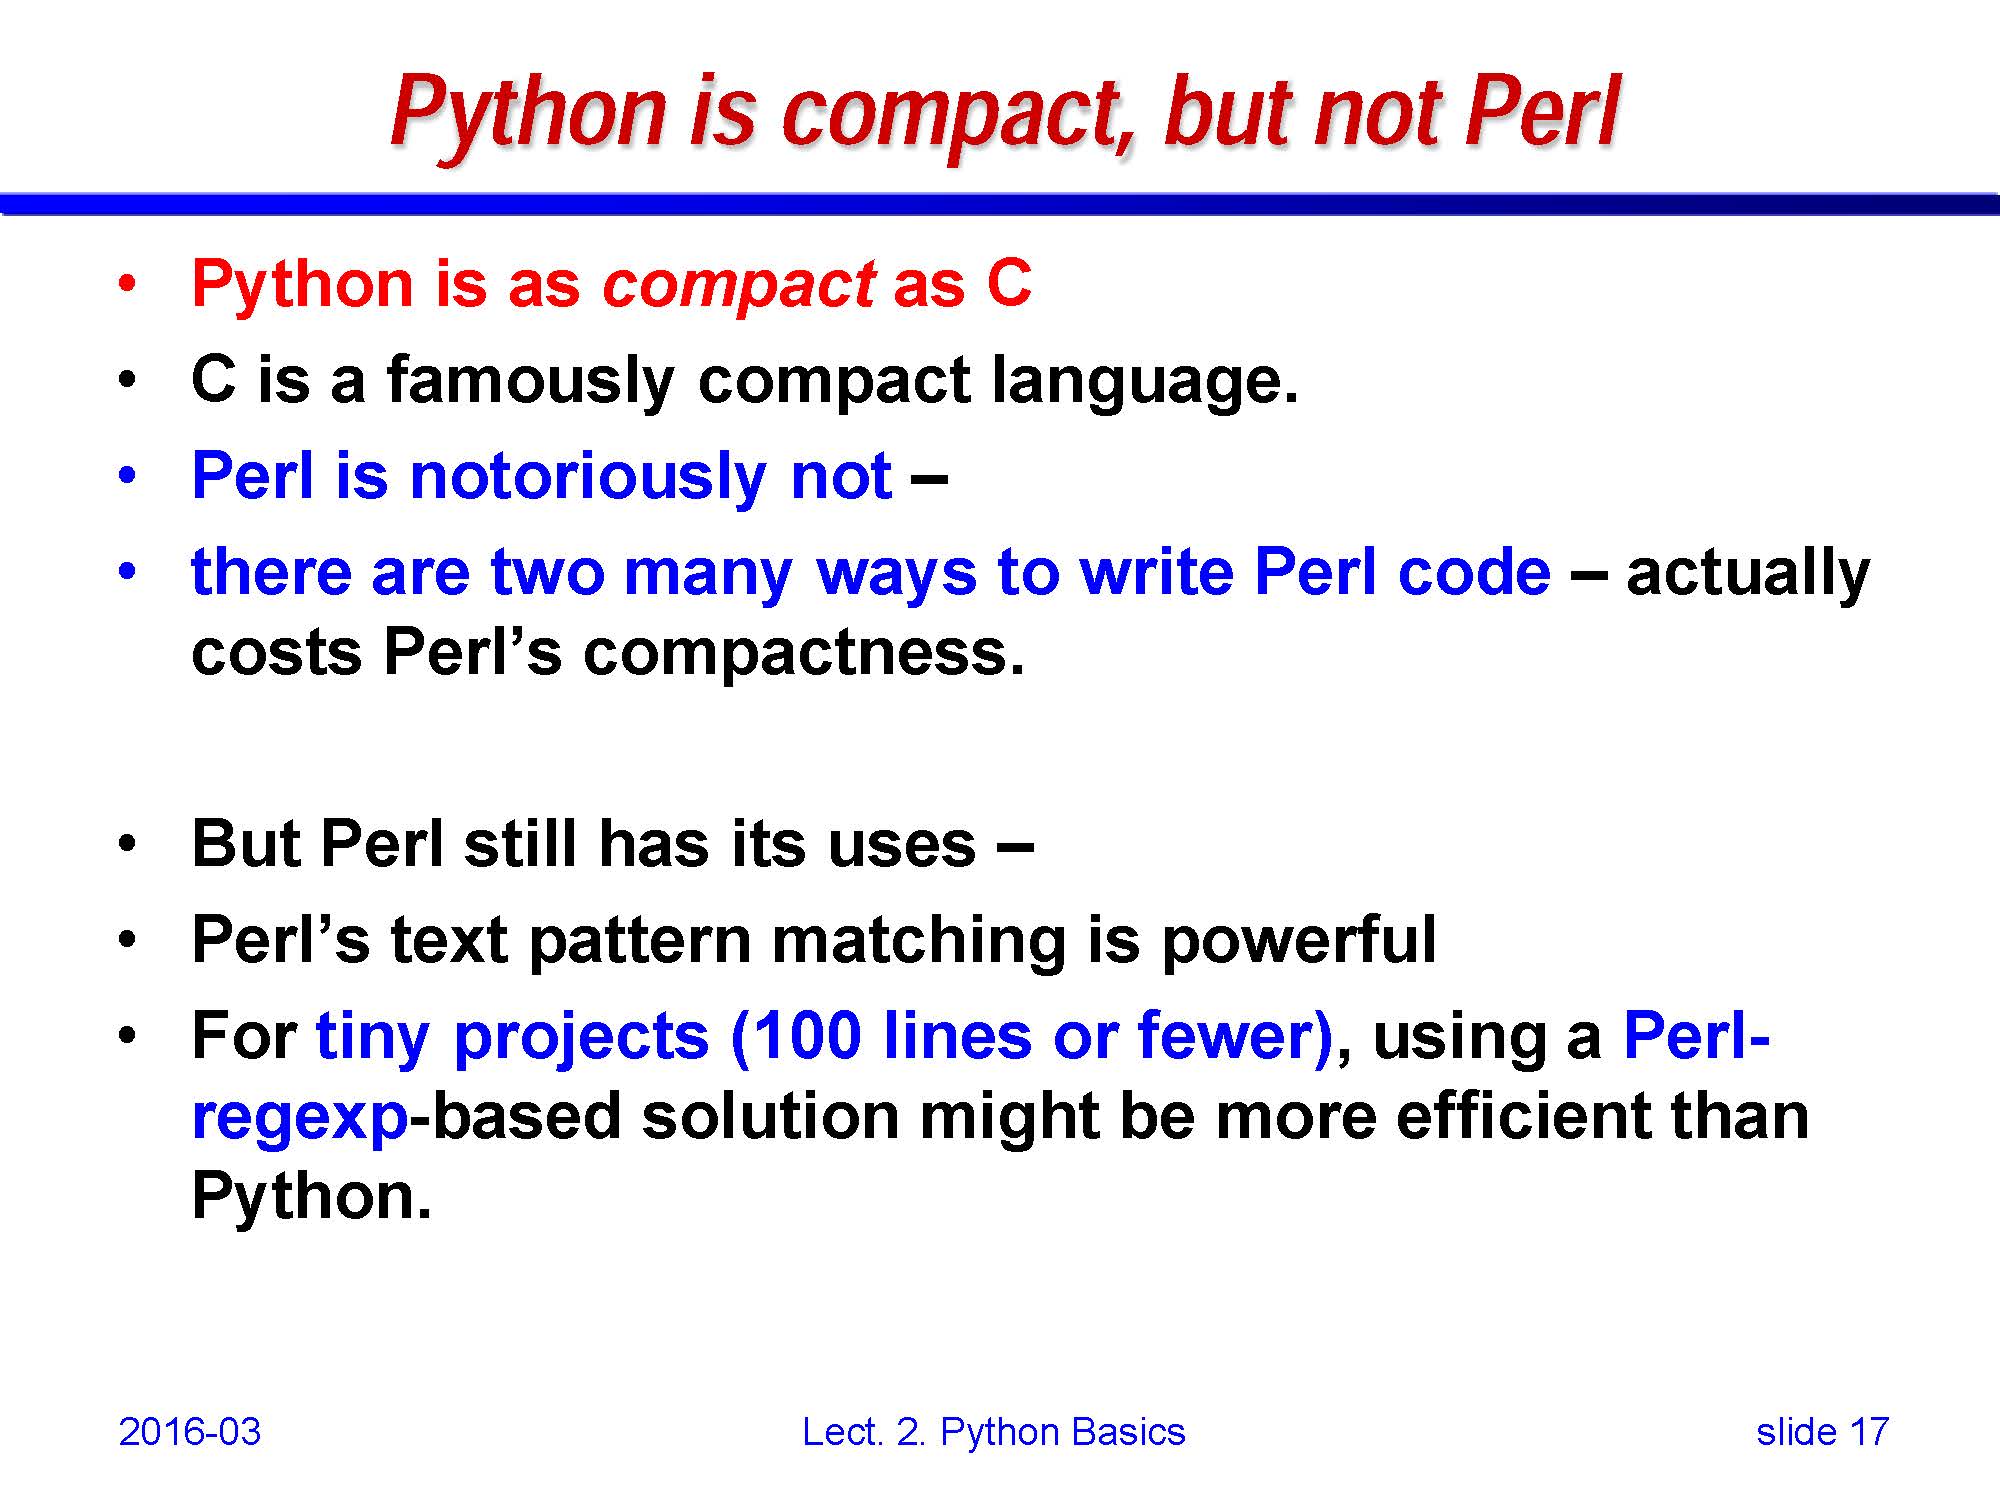
• Python versus perl
• more on Python graph plotting